
[caption id="attachment_6302" align="aligncenter" width="400"]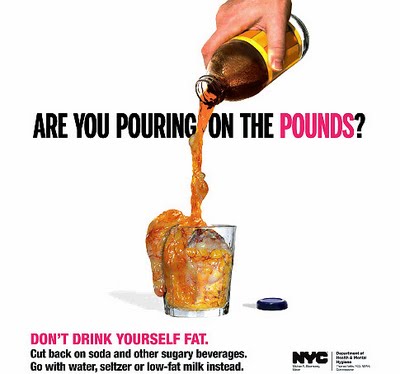 Does this ad get your attention?[/caption]
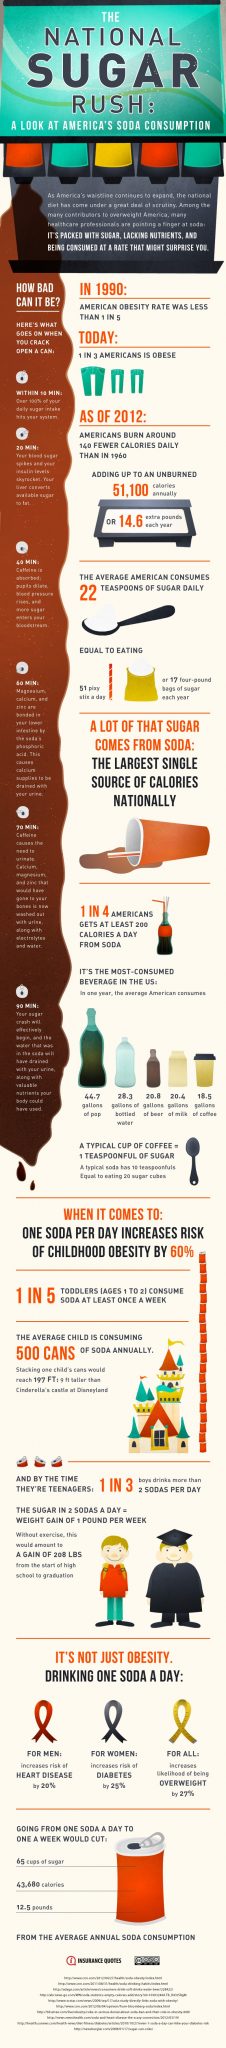
Does this ad get your attention?[/caption]"The National Sugar Rush: A Look At America’s Soda Consumption " - an infographic
With New York Mayor Bloomberg’s controversial proposition to ban 16 oz. sodas, many have begun to question the true effects of soda on one’s health. While seeking the insurance policy that’s best for you or your family, it’s important to keep in mind the health issues that are present in your life, as well as those that may one day become present. Taking note of, and being honest about, your lifestyle and state of health will ultimately be the most important factor in determining your proper insurance plan. That being the case, for the sake of insuring yourself and preparing for a healthy future, sometimes behaviors and habits are best changed to promote your own well-being. The average American is consuming large quantities of sugary drinks and soda each year, and while the idea of banning soda is raising eyebrows across the country, some of the statistics associated with soda consumption are having the same effect. For a nation that loves to crack open a Coca Cola, the idea of giving up soda seems nearly impossible. But as our waistlines expand and new health issues develop, the idea of at least cutting back on a bit of the fizzy stuff doesn’t seem like such a bad idea. The following infographic examines some of the facts and figures that go along with soda consumption, and might make you think twice before you pop the tab on that can of cola.
How much sugar do we consume in North America? More than we ought to


